Impact of Covid-19 on Public Transport Use in Stockholm
Introduction
The Division of Transport Planning, KTH, is collaborating with the Transport Administration at Region Stockholm to monitor the impacts of covid-19 on public transport use in Stockholm. The analysis is based on smartcard ticket data from the Access system owned by Region Stockholm. We will update the analysis regularly to follow the development.
The following analysis is based on data until 24 April 2022.
Publications
Jenelius, E. and Cebecauer, M. (2020) Impacts of COVID-19 on public transport ridership in Sweden: Analysis of ticket validations, sales and passenger counts. Transportation Research Interdisciplinary Perspectives 8, 100242.
Almlöf, E., Rubensson, I., Cebecauer, M. and Jenelius, E. (2021) Who continued travelling by public transport during COVID-19? Socioeconomic factors explaining travel behaviour in Stockholm 2020 based on smart card data. European Transport Research Review 13, 31.
Jenelius, E. (2020) Så har Covid-19 påverkat kollektivtrafikresandet i Sverige. Trafik & Veje September 2020 (in Swedish).
Talks available online
Impacts of Covid-19 on public transport use in Sweden, EIT Urban Mobility Nordic Perspective Summit, 13 October 2020.
Trips per public transport mode
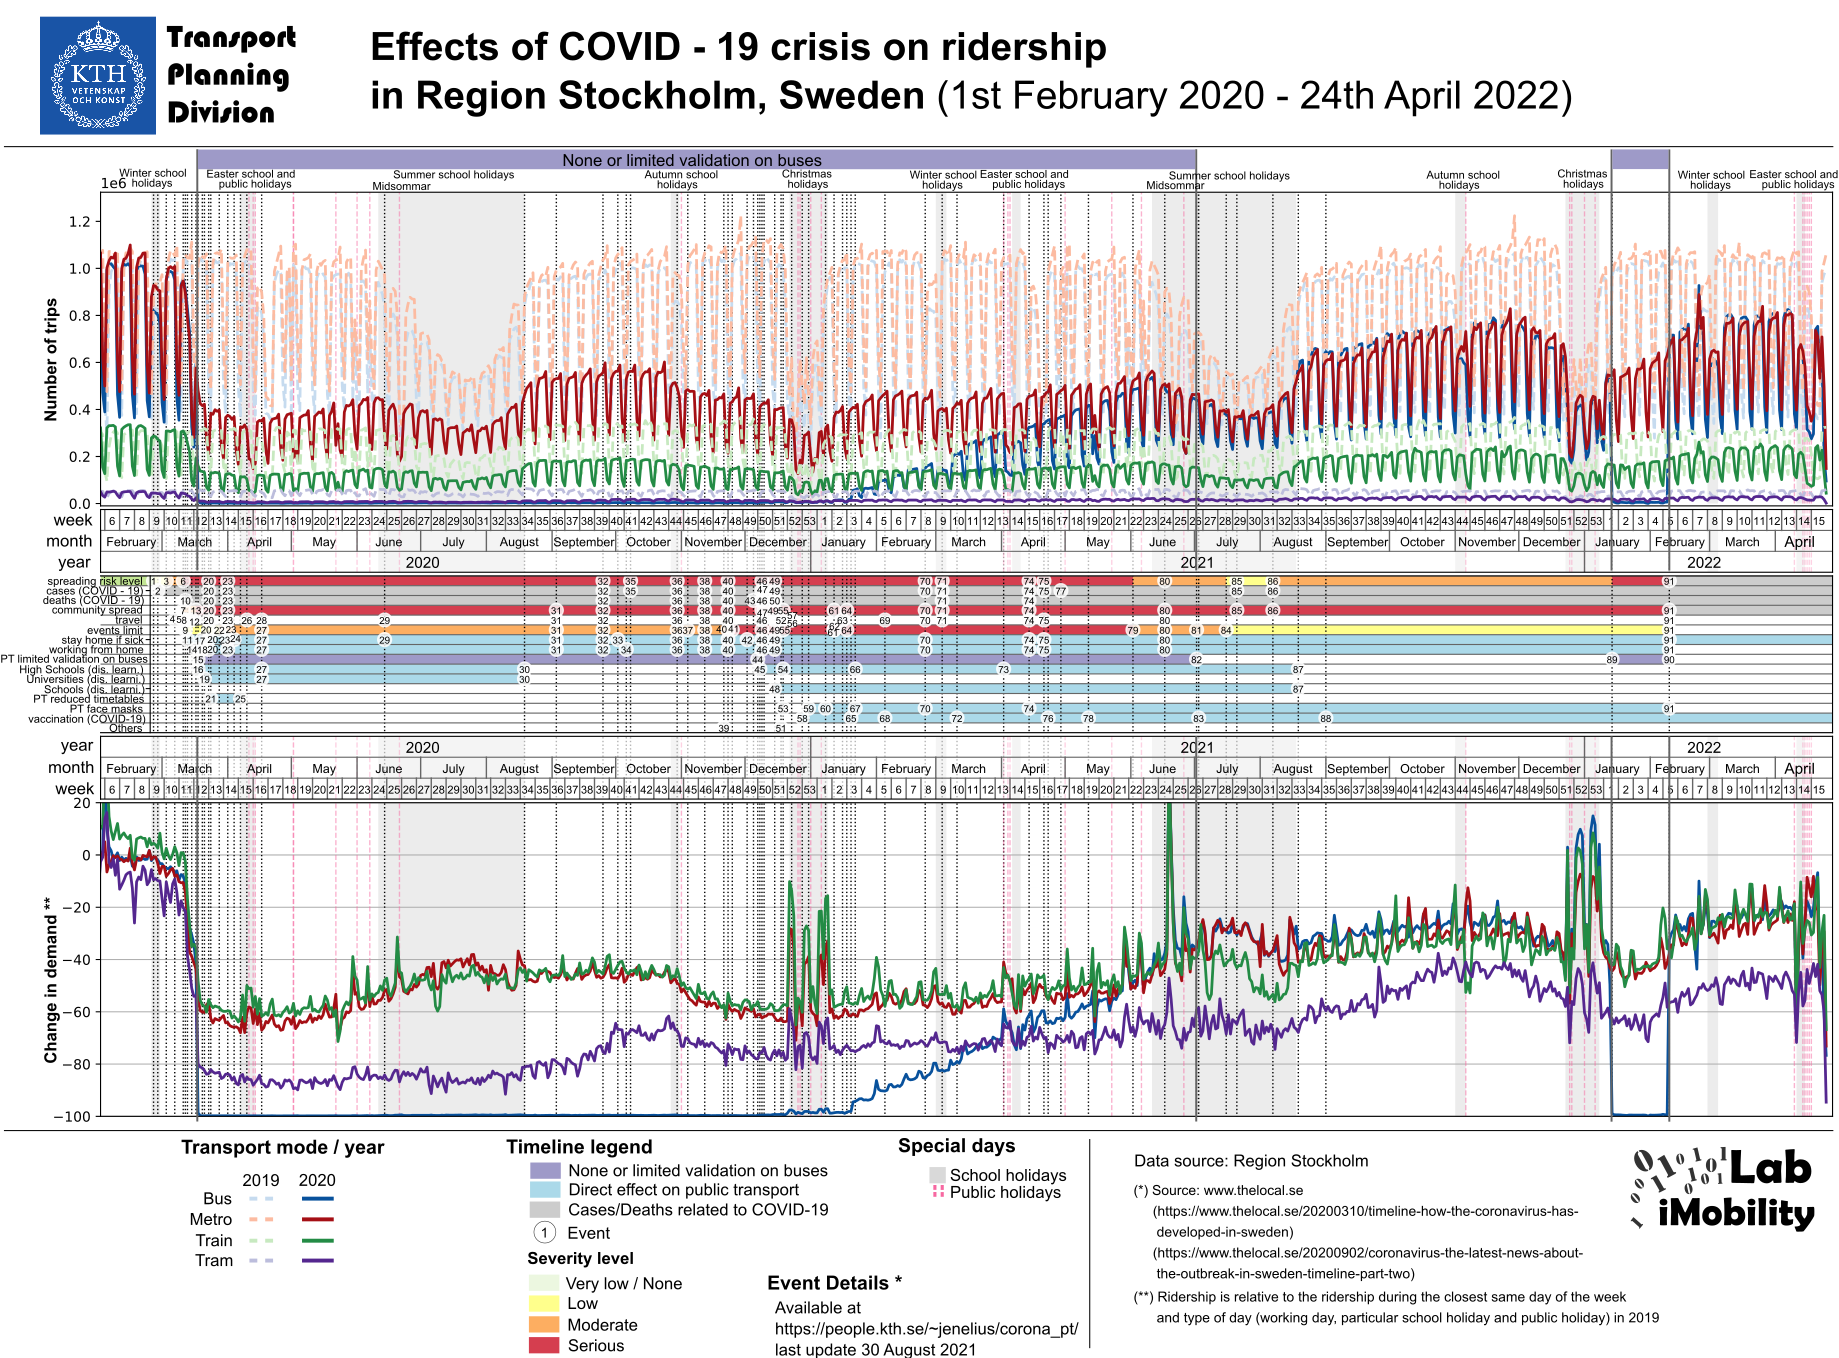
The upper timeline in the following diagram shows the number of trips each day for different public transport modes (bus, metro, commuter train, tram and light rail transit, and ferry) from the start of 2020. As reference, the corresponding numbers for the year 2019 are shown. The bottom timeline shows the numbers for 2020 relative to 2019. Note: From 17 March 2020 to July 2021, bus passengers were asked to board through the rear doors and not validate their tickets at the front doors. Therefore, during this period the Access card data do not represent the actual number of bus trips. Due to similar ticket validation policy changes for trams, the number of tram trips are also under-represented.
In absolute numbers, ridership reached the highest levels in June 2020 just before school holidays. After a period of lower activity during summer, ridership increased again during August. Relative to last year, however, ridership in August was down more than 50%. The strongest recovery occurred in July, when fewer people than usual went away on holiday. Ridership decreased again during the second wave starting in November 2020, reaching almost the same low levels as in April 2020.
In October 2021 Swedish society removed restrictions on social events and public transport travel. As of April 2022, ridership is still down 20%-40% across different modes. Buses, metro and commuter trains all show similar rates of recovery.
List of events referenced in the diagram
Trips per ticket type
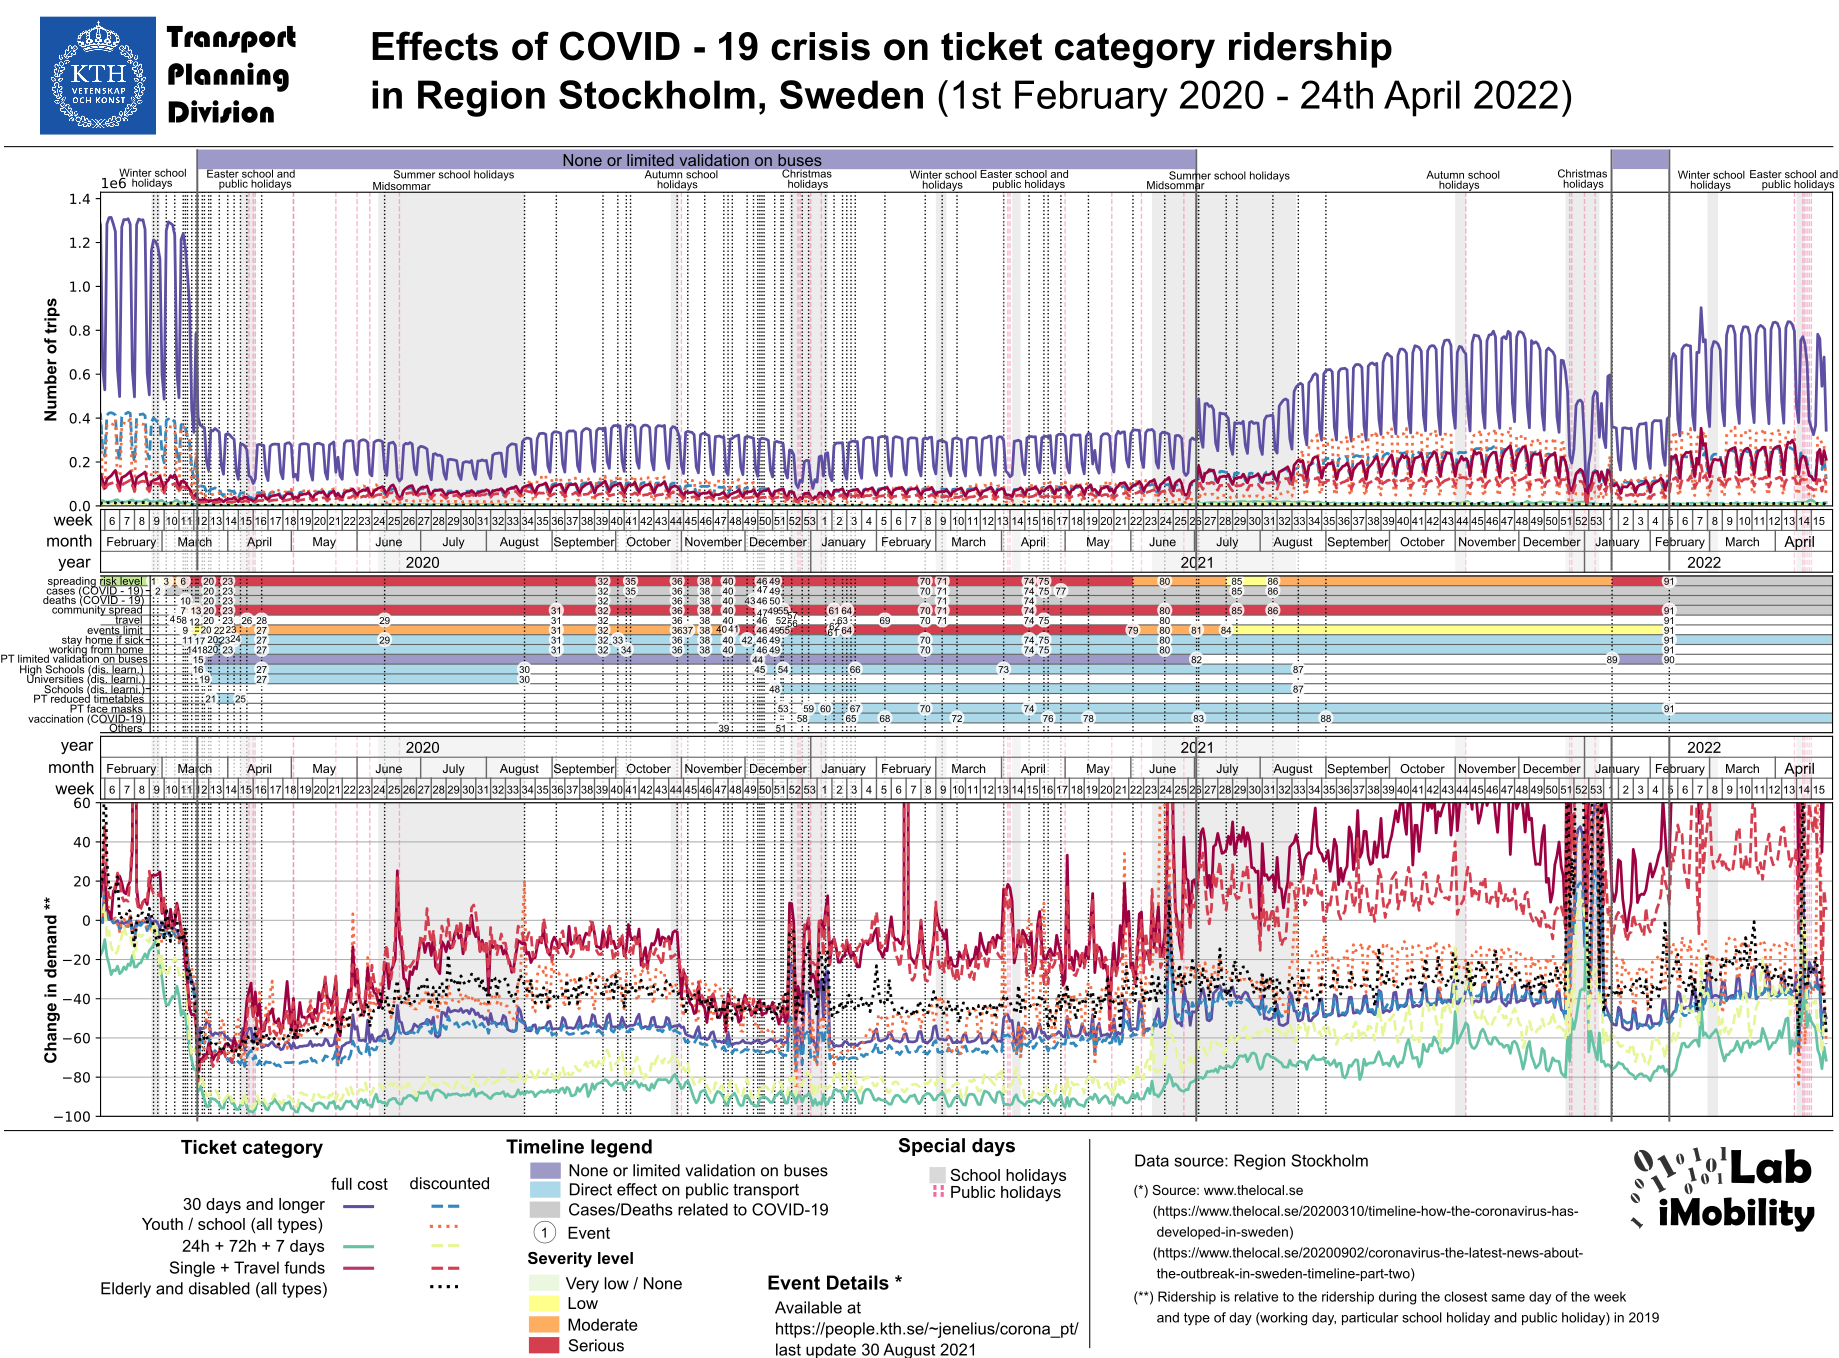
The upper timeline in the following diagram shows the number of trips each day for different public transport ticket types (period cards 30+ days, youth/school, day/weekend/week, and single trip/travel funds) from the start of 2020. As reference, the corresponding numbers for the year 2019 are shown. The bottom timeline shows the numbers for 2020 relative to 2019. Note: From 17 March 2020, bus passengers are asked to board through the rear doors and not validate their tickets at the front doors. Bus trips have been excluded in the diagram to allow for a meaningful comparison between 2020 and 2019.
While all ticket types decreased substantially between 10 March and 20 March 2020, single trip tickets and travel funds steadily increased relative to last year until late July. This indicates that travellers were switching to single trip tickets and travel funds from other less flexible ticket types (period cards) as they travel less. There is also a tendency that trips with yearly cards and youth/school cards have increased since mid-April. During autumn 2021 the use of travel funds reached higher levels than even before the pandemic.
List of events referenced in the diagram
Number of active cards and trips per card
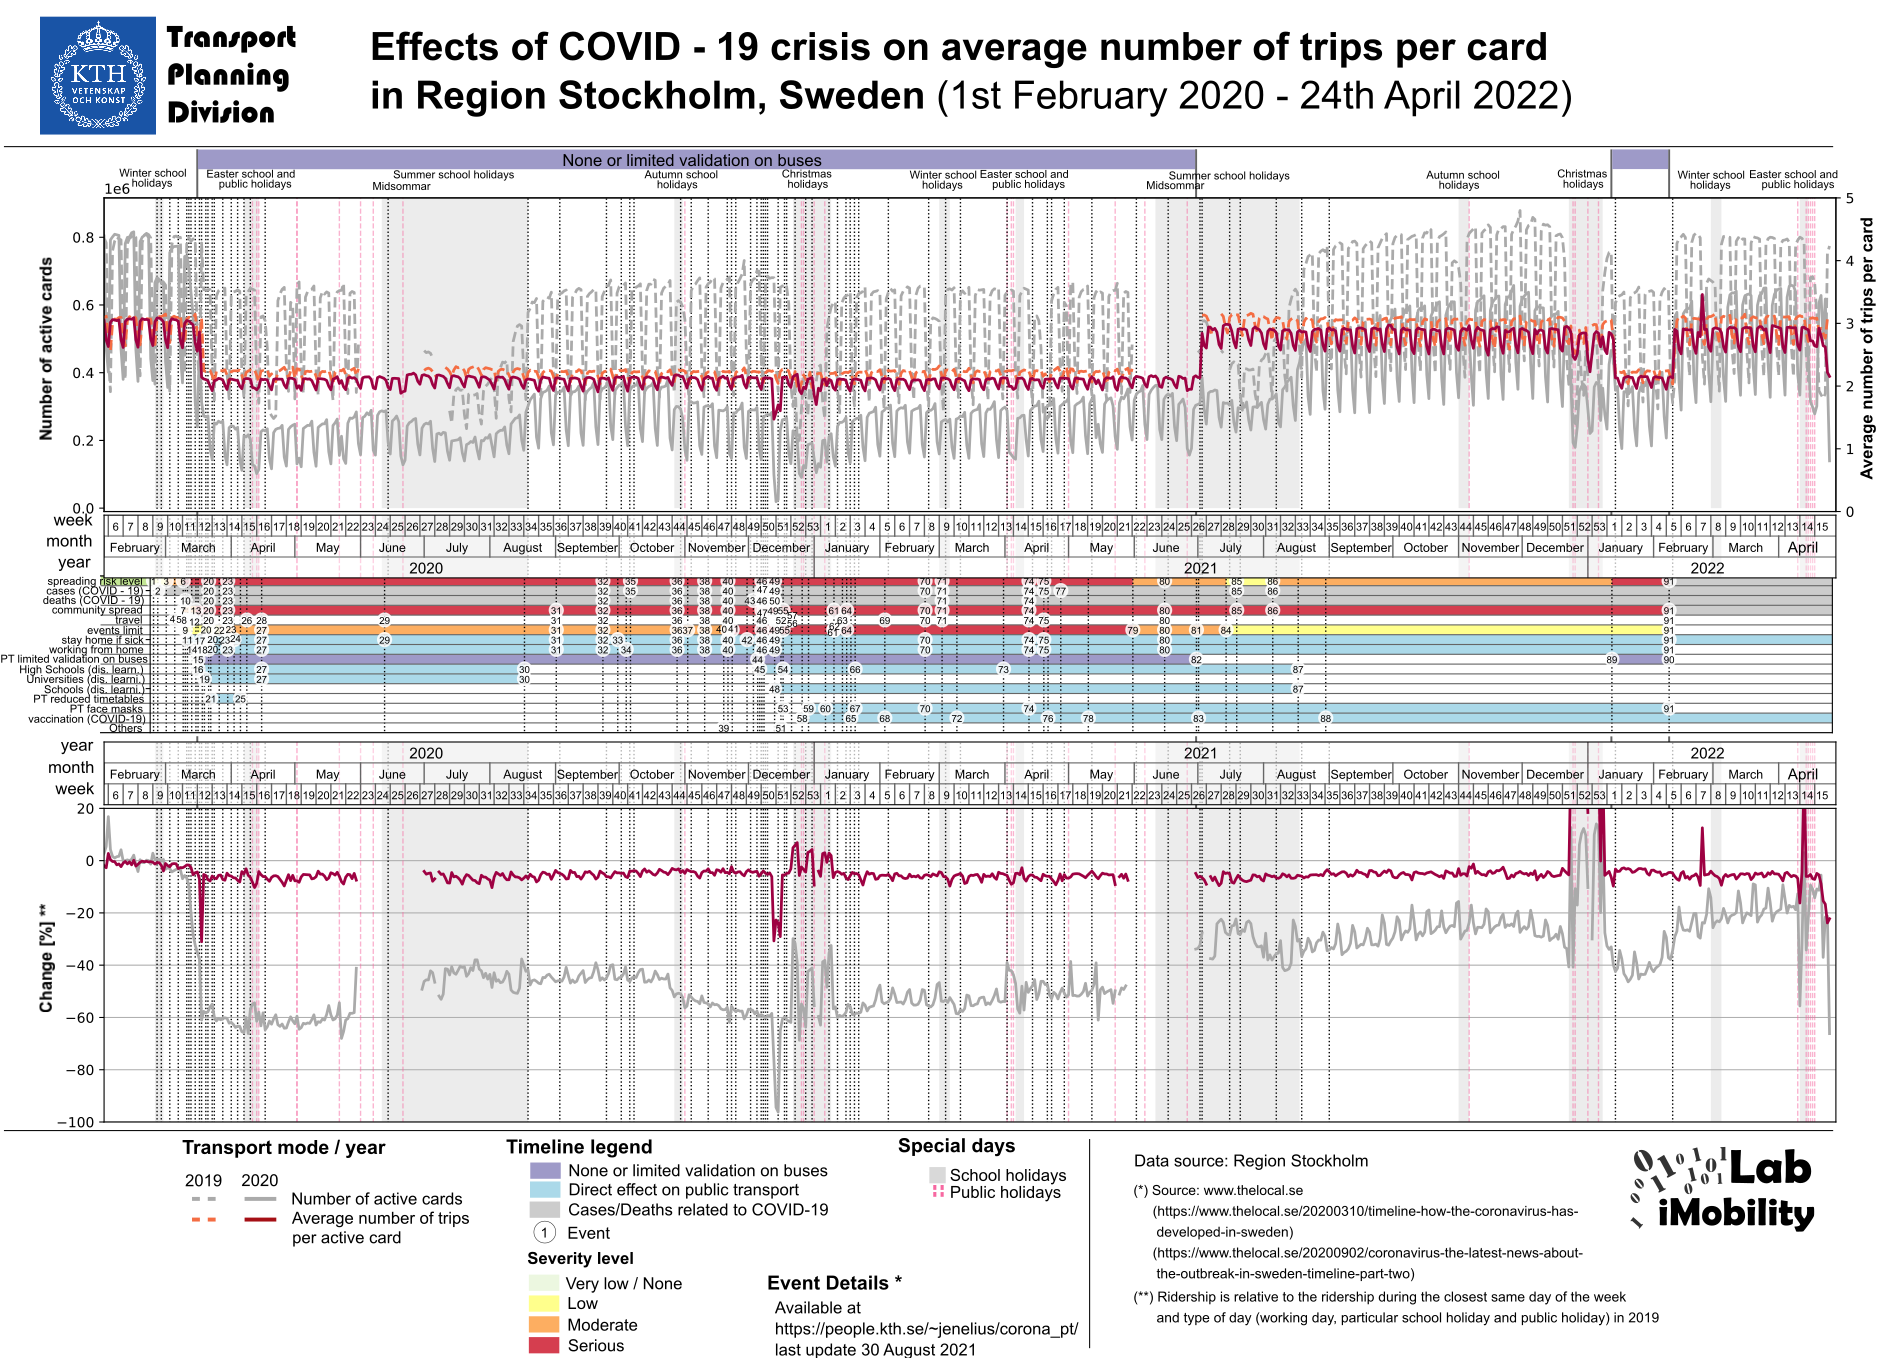
The upper timeline in the following diagram shows the number of Access cards that were in active use each day from the start of 2020. The timeline also shows the average number of trips per active card each day. As reference, the corresponding numbers for the year 2019 are shown. The bottom timeline shows the numbers for 2020 relative to 2019. Note: From 17 March 2020, bus passengers are asked to board through the rear doors and not validate their tickets at the front doors. Bus trips have been excluded in the diagram to allow for a meaningful comparison between 2020 and 2019.
The daily number of active cards decreased substantially between 10 March and 20 March 2020. In the subsequent period before vacations the number of active cards remained relatively stable at around 40% of the 2019 level (60% decrease), with a slight increase from mid-April and onward. Meanwhile, the average number of trips per active card has remained almost unchanged. This indicates that some travellers are unable or unwilling to change their travel patterns.
List of events referenced in the diagram
Contact
KTH Royal Institute of Technology
Dept. of Civil and Architectural Engineering
SE-100 44 Stockholm, Sweden