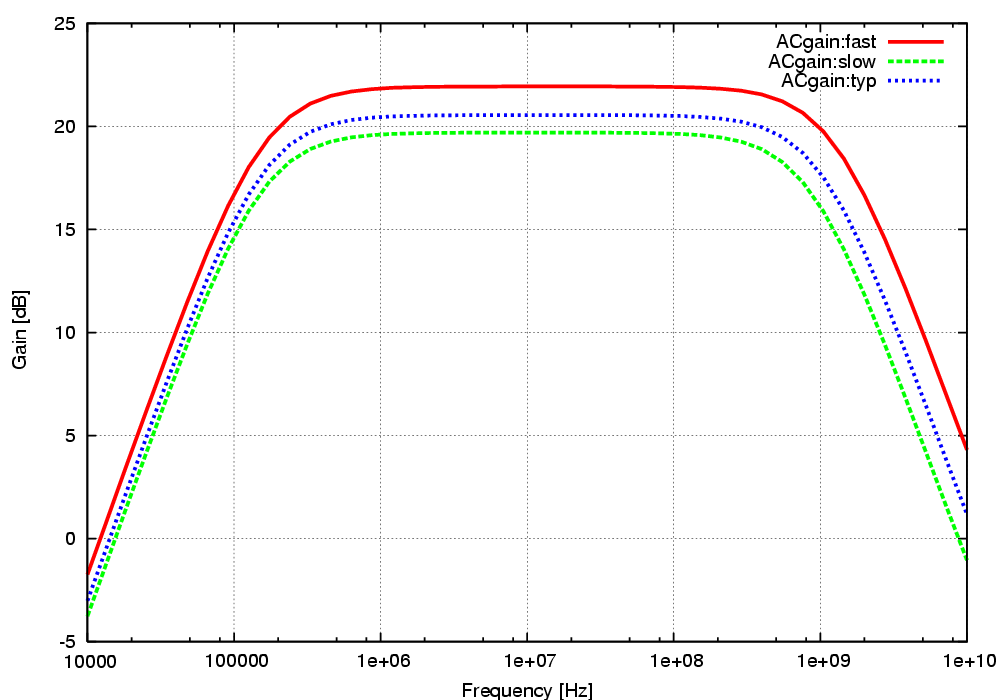
Fig-1: AC gain
AC response of the circuit is plotted in figure 1.
Transient simulation of the input and output waveform is plotted in figure 2.
A swept simulation where the transient output amplitude vs input amplitude is plotted in figure 3.
All transient simulations are performed in the typ corner.
Fig-1: AC gain
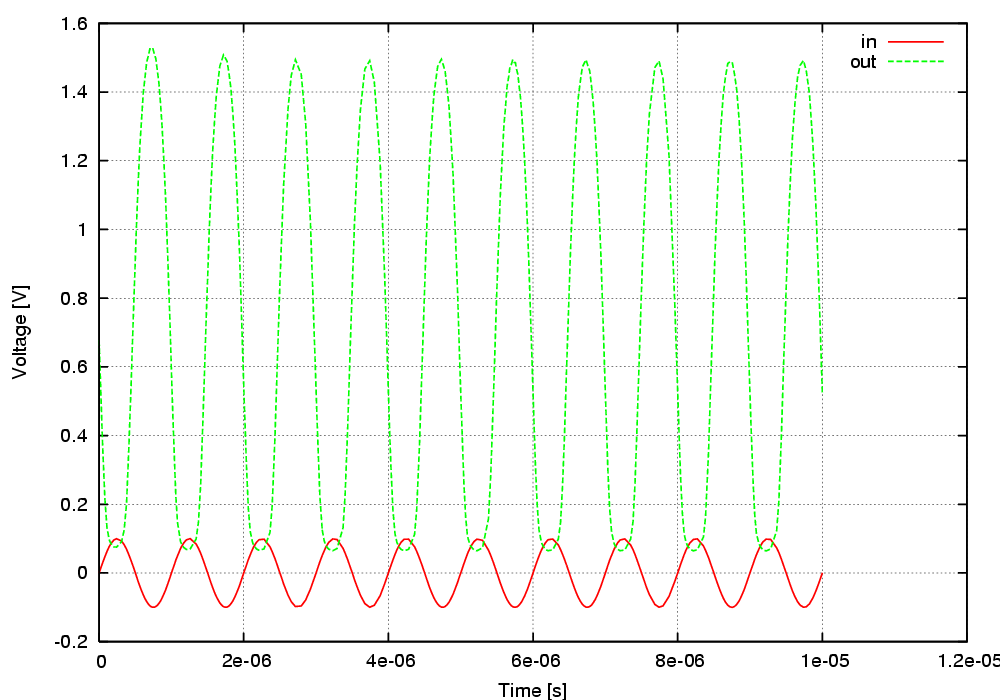
Fig-2: Transient waveforms
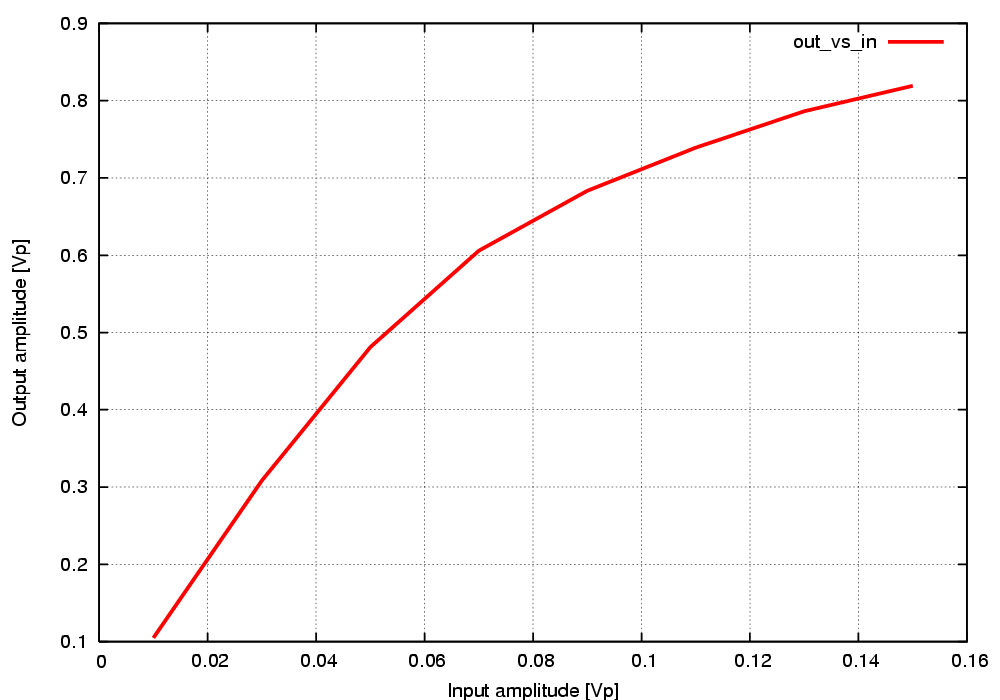
Fig-3: Output amplitude vs input amplitude