Compute bounds on end-to-end delays of cause-effect chains.
Synthesise job-level dependencies to meet age constraints.
Analyse systems of cause-effect chains with specified job-level dependencies.
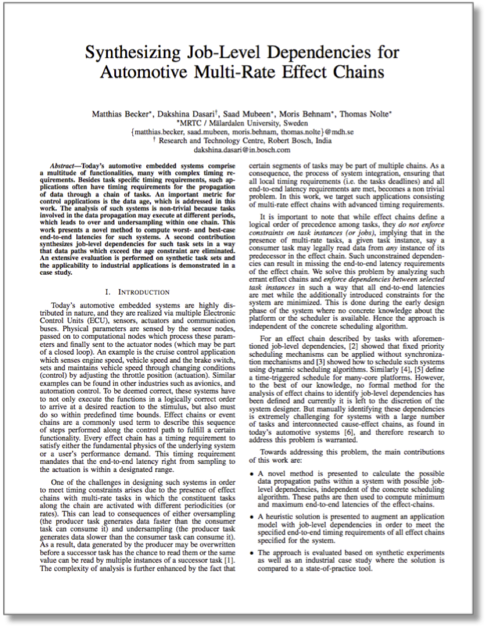
The concepts implemented in MECHAniSer are based on the paper "Synthesizing Job-Level Dependencies for Automotive Multi-Rate Effect Chains", in the proceedings of 22nd IEEE International Conference on Embedded and Real-Time Computing Systems (RTCSA), 2016.
The tool is developed in Java which makes it platform independent.
Installation is not required, the provided .jar file can be executed directly on all platforms.
The download provides the tool as well as a folder which serves as a standard location for MECHAniSer project files.
The demo project CaseStudy.xml is already in the folder.
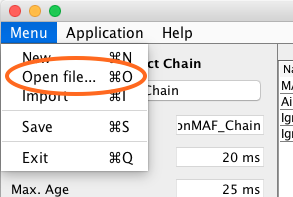
A project file can be opened by clicking on Menu/Open.
Alternatively a project files can be imported from other tools via Menu/Import.
To open the provided case study select the file in /data/CaseStudy.xml and click ok.
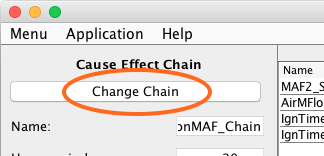
In a first step the initially selected cause-effect chain is changed. To do so click on Change Chain.
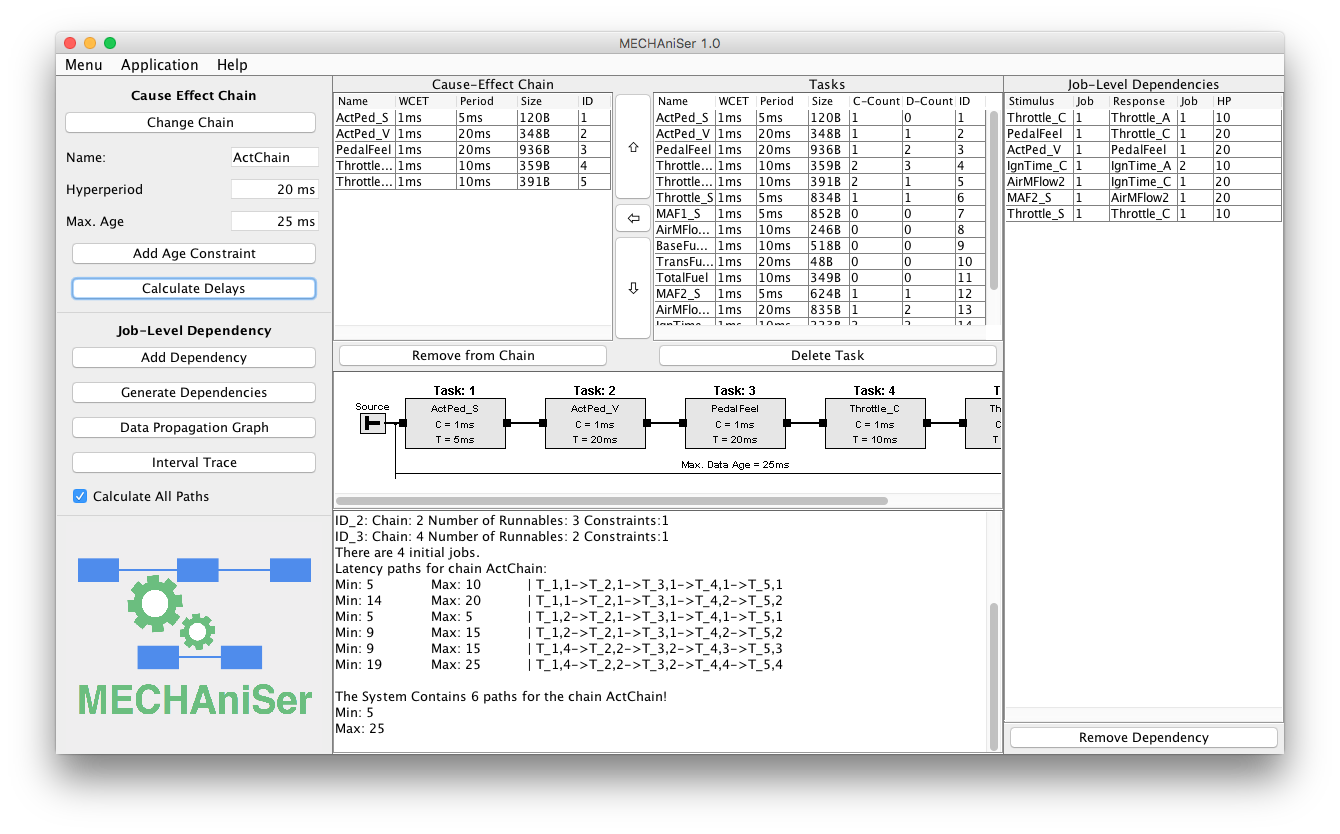
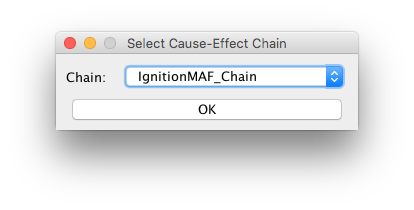
The window to select a cause-effect chain opens. Select IgnitionMAF_Chain and click ok. The chain in focus changes and the view is now equal to the screenshot of the main window above.
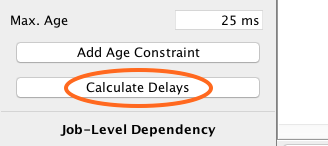
In order to calculate all data propagation paths of the chain IgnitionMAF_Chain and to determine the minimum and maximum data age click Calculate Delays.
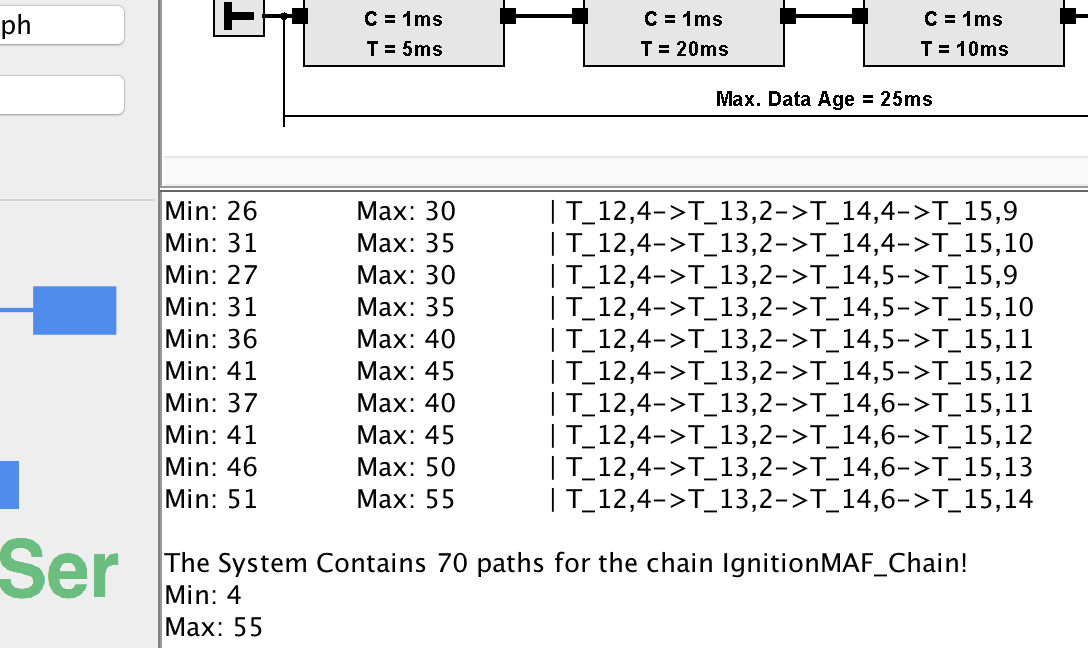
The output is provided in the text are. The tool reports a minimum data age of 4ms and a maximum data age of 55ms. We see that the specified data age constraint is 25ms and thus lower than the maximum data age.
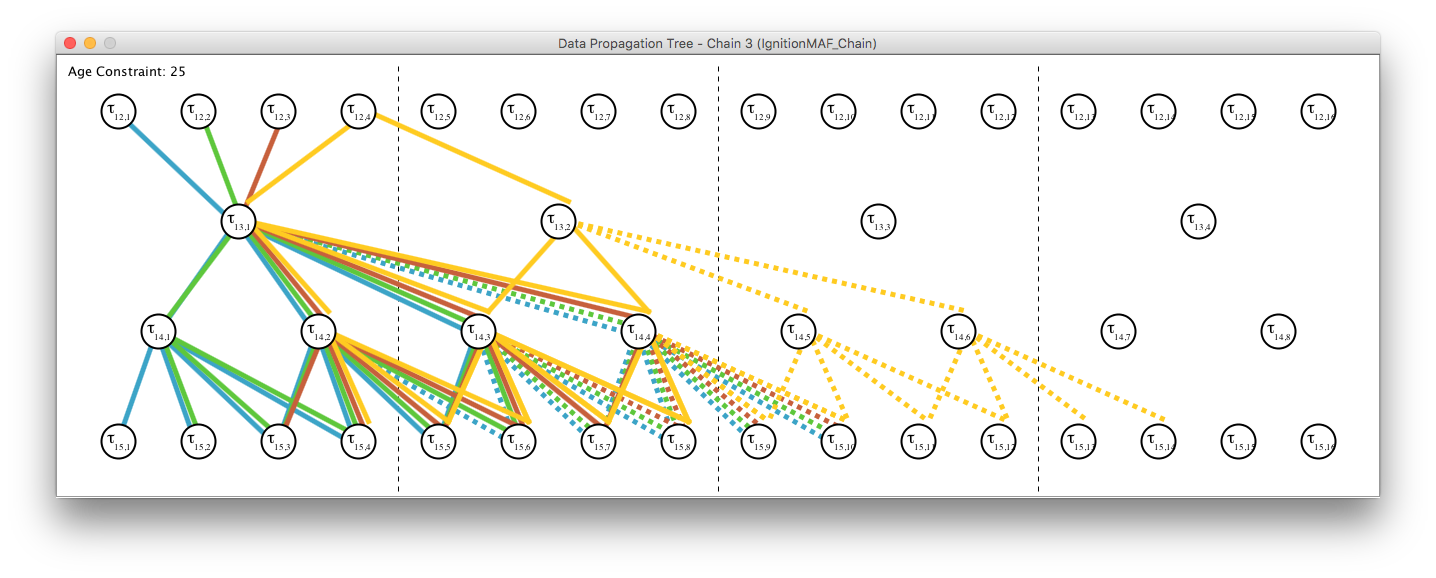
In order to get a clearer view of the different paths the graph view can be utilised. Open this view by clicking on Data Propagation Path on the main window. A window will appear and show the graph view.
The view shows all involved task instances as nodes, and all possible data propagation paths are depict as edges. Paths which lead to a larger end-to-end delay than the specified constraint are shown in dashed lines. Detailed information of nodes can be obtained by clicking on them.
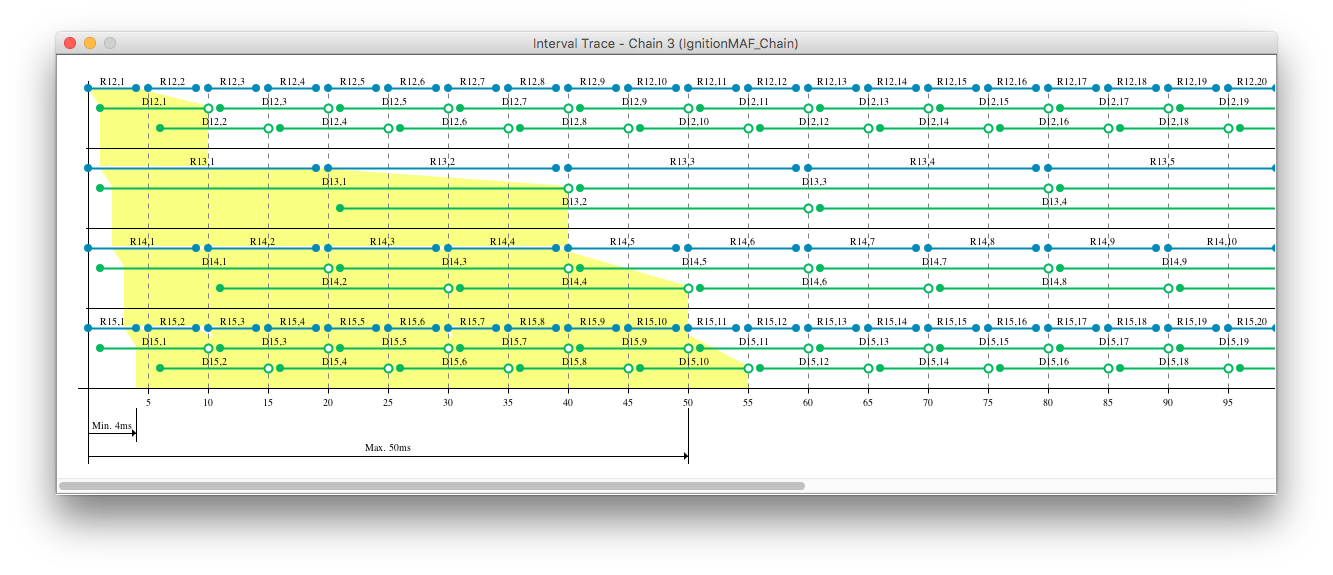
The trace view can be utilised to see the exact intervals when a job may read input data and when a jobs output data may be available. Open this view by clicking on Interval Trace. A window will appear and show the trace view.
Since some of the data-propagation trees have larger maximum data age than the constraint allows this step will demonstrate how to generate job-level dependencies to meet the constraint. Note that this is done
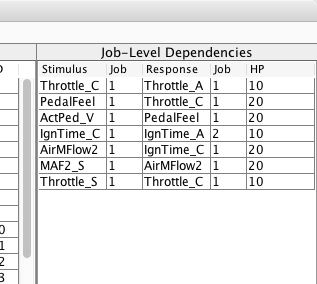
on system level for all specified cause-effect chains. To generate the job-level dependencies click on the button Generate Dependencies.

The left table Job-Level Dependencies now shows the generated dependencies.
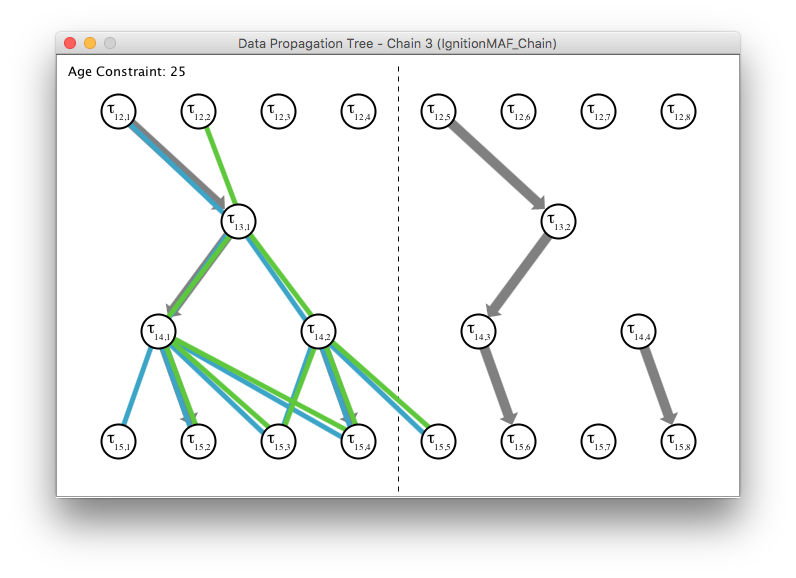
Open the data propagation graph again. The generated job-level dependencies are accounted for and visualised via gray arrows. Note that no dashed lines are in the graph which means that the age constraint is met.
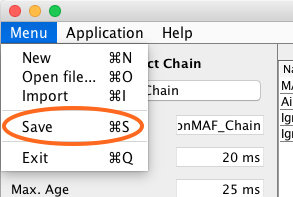
The changes can be saved to the project. This is done by clicking on Menu/Save.
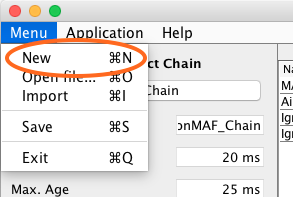
Starting a new project can be done by clicking on Menu/New. Note that previously unsaved changes are lost at this point.
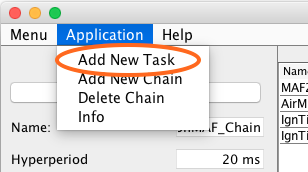
A new task can be added to the project by clicking on Application/Add New Task.
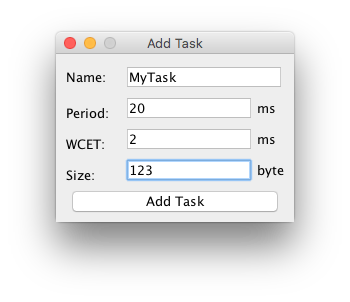
A window will appear and the tasks paramers can be selected. Create a task with a period of 20ms and a worst case execution time of 2ms. Note that in this version only ms values can be added. Click ok to add the task.
Do the same again fro a second task. This time with period 4ms and an execution time of 1ms.
A new cause-effect chain can be added to the project by clicking on Application/Add New Chain.
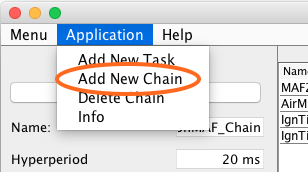
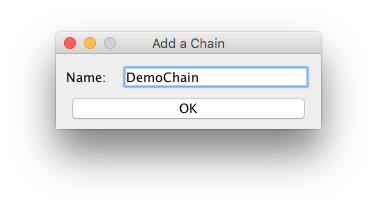
Insert a name of your choice and slick ok.
The new chain will be automatically in focus, but empty.
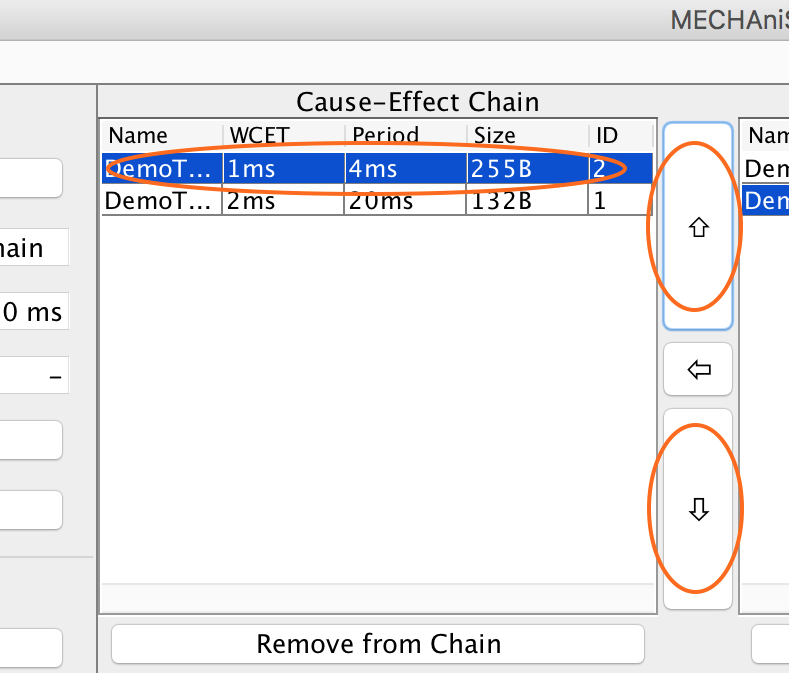
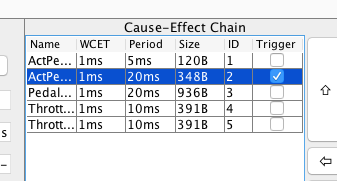
We add both tasks to the cause-effect chain. First select a task in the table Tasks, then click on the button ⇦. This adds the task to the cause-effect chain. Do this for both tasks.

When adding tasks to a chain they are always appended at the end. Often that is not the final position. To change the position of a task, select the task in the table Cause-Effect Chain and click on the button ⇧ or ⇩
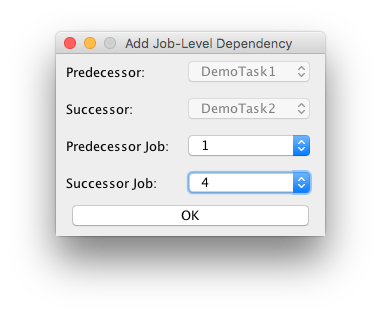
Job-level dependencies can also be added manually. To do so, click on the button Add Dependency. A window will appear.
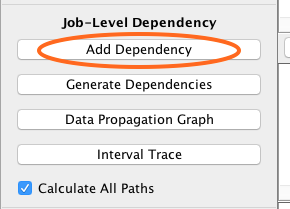
In the new window you have 4 drop-down menus, 2 are enabled. Select the Predecessor and the Successor task. Once done the two remaining drop-down menus become enabled while the others get locked. Select the instance of the jobs of each task which are dependent on each other. Note that this is relative to the hyperperiod of the two tasks only. Click ok to add the dependency.
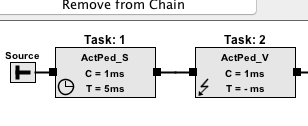
A task in a cause-effect chain can be optionally triggered by its predecessor. To do so, mark the checkbox in the chain table. An event triggered task inherits the period of the predecessor task, and cannot be part of a second chain.
The trigger behaviour of each task in a chain is additionally visualised in the chain-view.
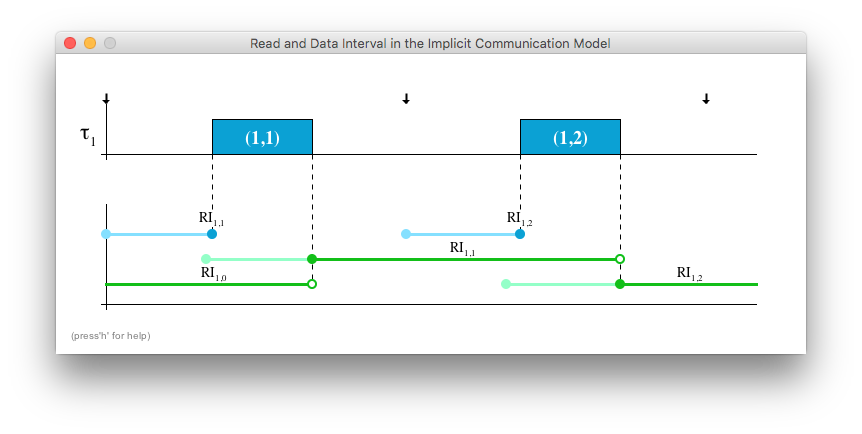
When clicking on Help/Help a new window opens. This window shows two jobs and the resulting read and data interval depending on their current position. Change the position of the jobs by dragging them with the mouse. The interval where data may be read and available respectively are shown in lighter color. The extremes represent the read interval and the data interval.
Information is provided by pressing the h key and visited intervals are reset by pressing the spacebar