
Collaborative Project 2020-2025HiSS: Humanizing the Sustainable Smart CityCase Study [c]: Finding correlations and causality in Live-In Lab Testbed dataMahsa Farjadnia, Karl H. Johansson, Hedvig Kjellström, Marco Molinari, and Ruibo Tu | ||||
|
The goal of this case study is to apply to a real building scenario automated approaches to isolate correlations among large set of sensors and showcase the possibility to find causality. The capability to find causality is invaluable. The way we want to use it is to detect faulty settings in buildings - leading to anomalous energy use and discomfort - and to promote energy efficiency in buildings exploiting behavioral dynamics, rather than providing normative feedback to the building users. The case study illustrated here is an example relative to the opening of windows, but the approach can be straightforwardly adapted to other building dynamics. Electricity for ventilation is becoming an important part of the energy used to operate a building. Electricity consumption for ventilation can be reduced with natural ventilation by having people operating the windows; however, this is not a trivial problem because the operation should be performed only in favorable, time-varying outdoor conditions and moreover due to the complex behavioral dynamics involved. The Live-In Lab Testbed KTH offers a perfect experimental setup for the case study: it is a testbed representative of modern residential buildings, with four separate apartments - a bathroom and a bedroom - and with a shared kitchen and living room. This case study will be initially developed in three steps: |
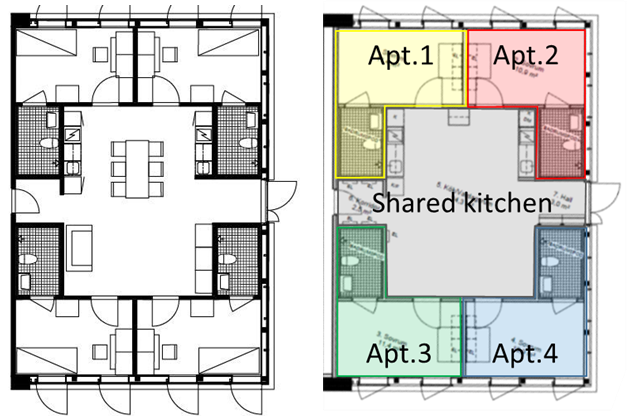
Layout of Live-In Lab Testbed KTH 2.0. The testbed is used as a student accommodation. Students live in separate apartments (colored areas) and share the kitchen and the living room (gray area). | |||
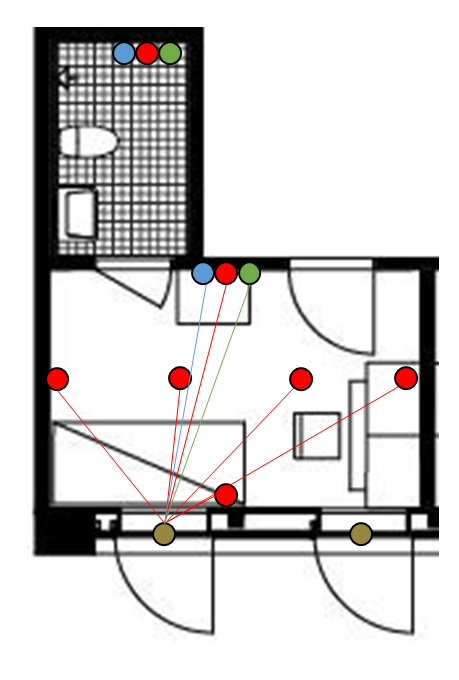
1) Analysis of correlations among sensors in a roomWhen a building occupant opens a window, this event can be observed in the readings of temperature, CO2 and RH sensors, to a degree that depends on several factors. Some of these factors are quantifiable or detectable (e.g., outdoor temperature), while some other ones are not (e.g., degree of opening of the window, opening of other internal doors are open). Correlations among sensors need to be identified and quantified, without a priori information about the sensor devices and placement. |
Testbed KTH 2.0 apartment layout with sensors. Light brown dots are magnetic sensors used to detect window opening, red dots r,epresent temperature sensors; CO2 sensors are represented in green, relative humidity sensors are in blue. |
 | ||
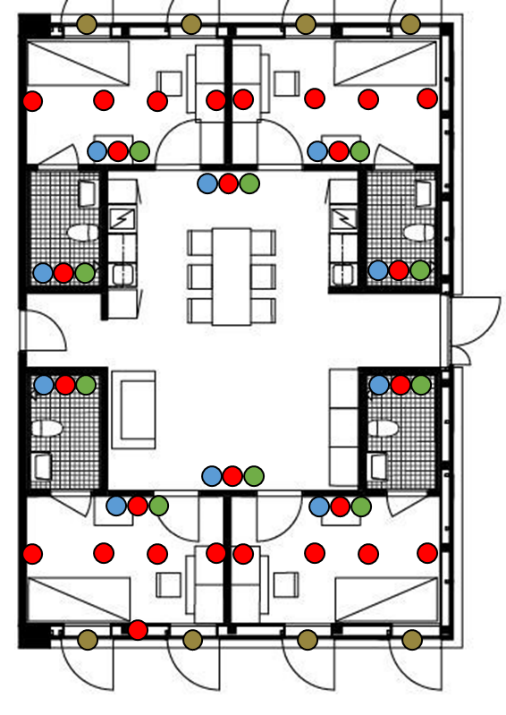
2) Extended automated analysis of correlationThe correlation analysis is extended to the data points in the whole testbed to identify which sensors are affected by a change of status in a sensor. Motion, light, VOC (Volatile Organic Compound) and additional sensors deployed in the project can be added in this analysis. |
Layout of the whole Testbed KTH 2.0 with sensors. Sensors represented here are window opening (light brown), temperature (red), humidity (blue), and CO2 (green). Light, motion and VOC sensors are not depicted. |
 | ||
3) From correlations to causalityThe final step in this case study consists in finding causality in the observed dynamics. Only focusing on correlations among sensors is not sufficient to identify the condition that triggers the action of opening the window. The different explanation scenarios shown below are equally possible. The opening of the window can be triggered by overheating (scenario A on the left), to decrease the indoor humidity after cooking or having a shower (scenario B), or by a too high indoor carbon dioxide concentration. In all cases the opening of the window is likely to noticeably affect the other parameters. The identification of the condition triggering the action is key to understand the behavior of the building users in this case study. |
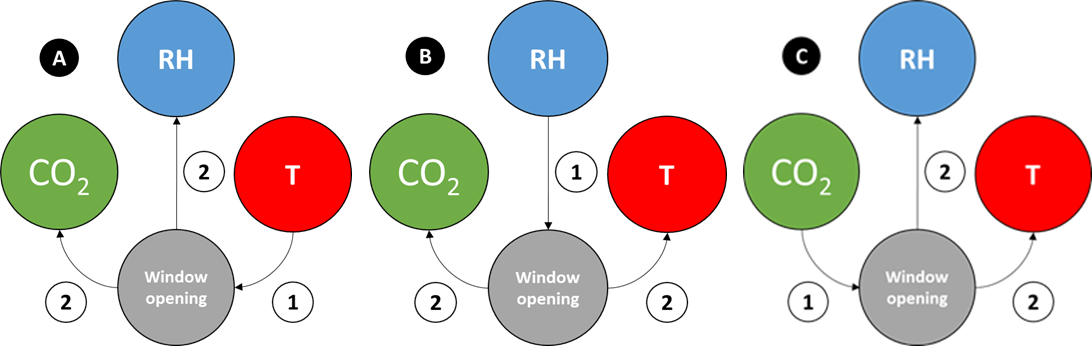 Explanation networks modeling the proposed setting. | |||