

IS-osc.
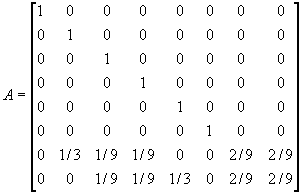
| Cycle matrix | Det = 0 |
 |
|
| Limit matrix |
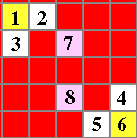
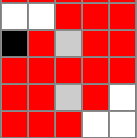
Genetic impact of bushing stator cells: g2=g5=3/5. g3=g4=2/5 |
Genetic graphs:
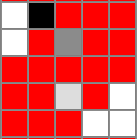
|
Note that the asymptotic colour indices of the rotor cells (nr 7 and 8) in the first graph
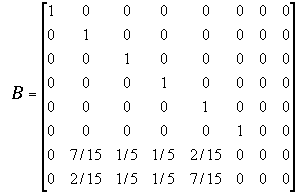
are given in column 2 (7th and 8th row respectively) of the limit matrix.
This column number corresponds to the black stator cell in position 2. Column 3
gives the corresponding colour indices of the second graph.
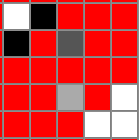
In the third graph the colour indices represent the sum of column 2 and 3, i.e. 2/3 and 1/3, since the stator cells 2 and 3 are black. |