Fig-5: Hot dogs
It is sometime useful to include design variables in the design documentation.
Design variables are included using the command
<<desvar:testbench1/script.ocn>>
The command extracts lines containing
desVar("variable" Value); Comment
and creates a table
| Variable | Value | Comment |
|---|---|---|
| Vsupply | 1.8 | Supply voltage |
| c1 | 100p | Parasitic load |
The variables are automatically extracted from an ocean script file. Only variable definitions printed at the beginning of a line will be included. This is in order to allow variables to be omitted from a table by simply adding a space in front of the variable name.
Output log-files can be inserted using
<<logfile:filename.txt>>
The log file is formatted using typewriter type font. Long lines are broken in order to not overflow the paper.
Schematics are included using
 <<sch:
 Schematic (Library)
 >>
where Schematic is the name of the schematic and Library is the library name. You currently have to specify the name of each schematic and library manually.
Schematics should be printed using hierarchical print from cadence to the directory sch in the documentation directory. Plot the schematics without header and remember the last / when specifying the plot path.
Figures and images are inserted using the command
<<img:image, position, size:Caption>>
where image is the name of the image without suffix specifying file type. .eps, .png, and .jpg images are recognised automatically.
The optional position and size are used to control the position and size of the image in the PDF output. Please consult the PlainDoc documentation for details.
Caption is the caption of the image.
Images can be referenced using the image name.
Currently all images have to be located in the documentation directory, including images fron sub-directories do not work.
Example:
<<img:hotdogs.jpg,,3:Hot dogs>>
includes the file hotdogs.jpg from the documentation directory.
Fig-5: Hot dogs
The size "3" makes the image fill 1/3 of the page width in the PDF document.
Tables are inserted using the table command:
 <<table:Example table
 Title1  Title2
 ======= ======
 Text    Value
 >>
Will insert a table:
Table 2:Example table
| Title1 | Title2 |
|---|---|
| Text | Value |
Equations are inserted using the eqn tag.
Syntax:
<<eqn:equation:tag>>
equation is the equation definition using TeX syntax. There are numerous sources of information regarding TeX on the internet. one good starting point is
http://www.artofproblemsolving.com/LaTeX/AoPS_L_GuideCommands.php
tag is an optional tag in order to allow referencing of the equation.
Example:
<<eqn:f_0=\frac{1}{2\pi\sqrt{L(C_0+C_{ext})}}:f_res>>
Generates the equation
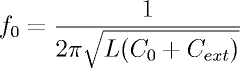 | (2) |
The see command is used to insert a reference
< <see : tag> >
The tag is replaced by the number of the figure, plot or table.
Referencing is done by name matching, where the tag that have the closest match is used. If the match is not exact a warning is generated when generating the document but the reference is still valid.